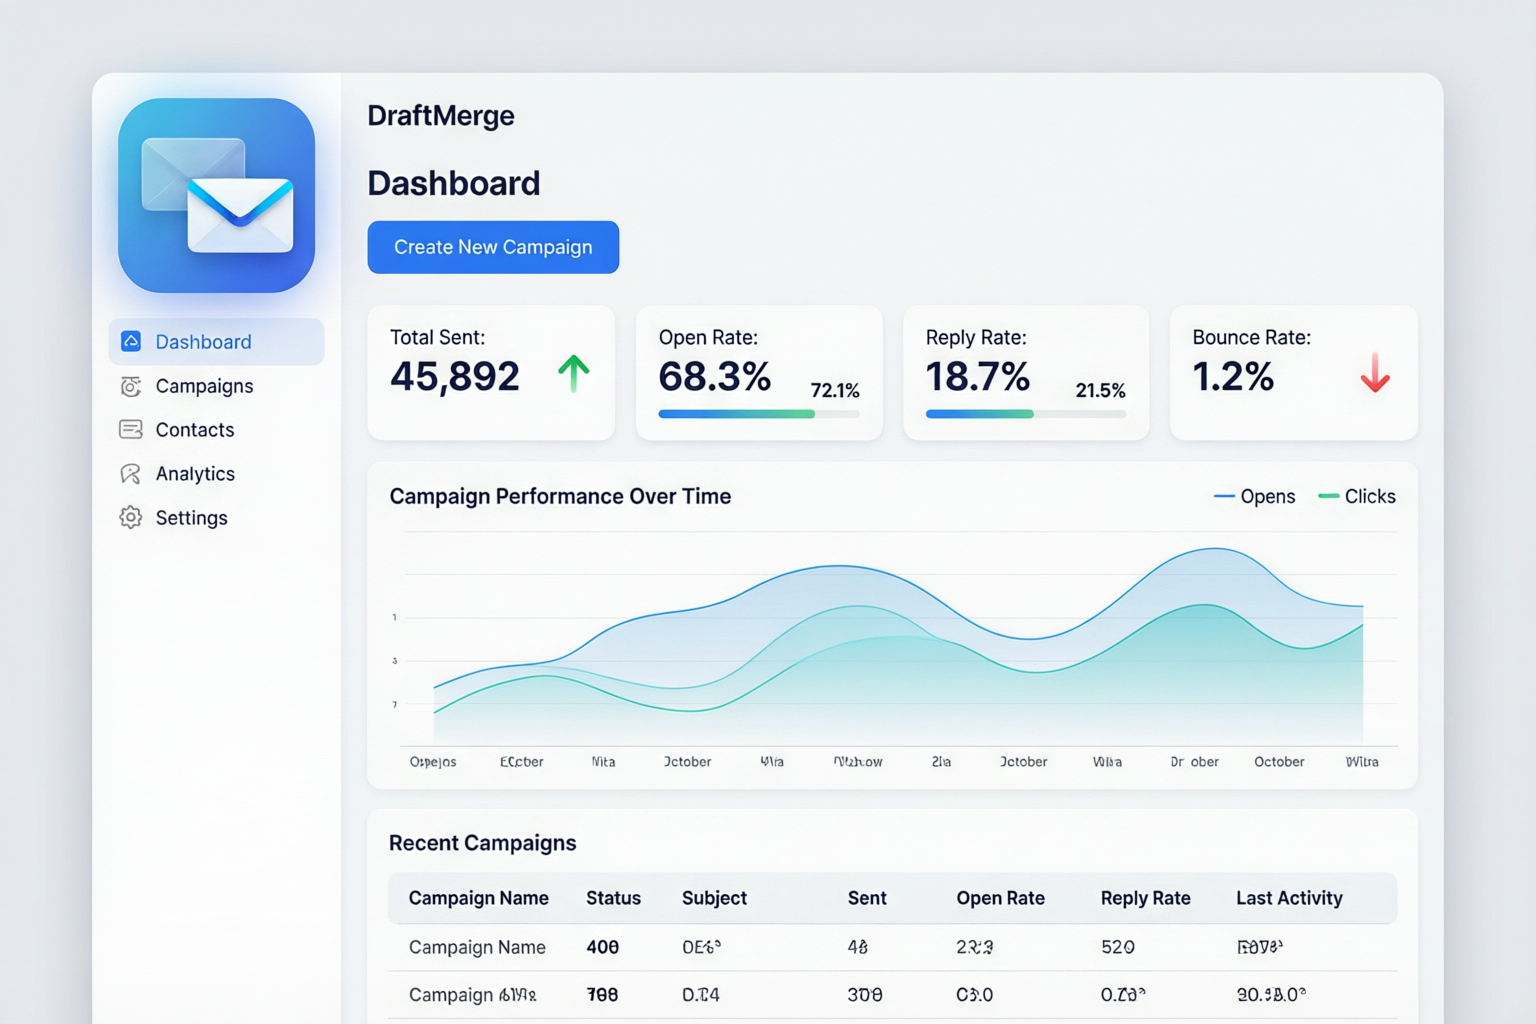
The DraftMerge Dashboard showing campaign metrics and performance analytics
Overview
The DraftMerge Dashboard provides real-time visibility into your email campaign performance. Track key metrics like delivery rates, open rates, reply rates, and bounce rates all in one place.
Key Metrics Explained
📧 Total Sent
The total number of emails successfully sent through Gmail API. This includes all emails that were accepted by Gmail for delivery.
Tip: This number updates in real-time as your campaign progresses.
📈 Open Rate
Percentage of recipients who opened your email. Calculated as: (Opens / Delivered) × 100
Industry Average: 15-25% for cold outreach emails
Note: Open tracking requires the recipient to load images in their email client.
💬 Reply Rate
Percentage of recipients who responded to your email. Calculated as: (Replies / Delivered) × 100
Industry Average: 1-5% for cold outreach emails
Tip: Higher reply rates indicate better personalization and targeting.
🚫 Bounce Rate
Percentage of emails that could not be delivered. Calculated as: (Bounces / Sent) × 100
Types of Bounces:
- Hard Bounce: Email address doesn't exist or is permanently invalid
- Soft Bounce: Temporary issue (full inbox, server down, etc.)
Warning: Keep bounce rate below 2% to maintain sender reputation.
Dashboard Features
1. Campaign Performance Chart
The interactive line chart shows your campaign metrics over time. Hover over data points to see exact values for specific dates.
- Time Range: View last 7 days, 30 days, or custom range
- Metrics Toggle: Show/hide specific metrics on the chart
- Export: Download chart data as CSV for further analysis
2. Recent Campaigns List
Quick access to your most recent campaigns with status indicators:
- ● Active: Campaign is currently sending
- ● Completed: All emails sent successfully
- ● Paused: Campaign temporarily stopped
- ● Failed: Campaign encountered errors
3. Events Sheet
Detailed log of all email events including:
- Sent: Email accepted by Gmail API
- Delivered: Email successfully reached recipient's server
- Opened: Recipient opened the email (if tracking enabled)
- Clicked: Recipient clicked a link in the email (if tracking enabled)
- Replied: Recipient responded to the email
- Bounced: Email could not be delivered
- Unsubscribed: Recipient opted out of future emails
Accessing the Dashboard
- Open the DraftMerge extension in Gmail
- Click the Dashboard tab in the top navigation
- View your campaign metrics and analytics
- Use filters to narrow down by date range, campaign, or status
Exporting Data
You can export your dashboard data for external analysis:
- Click the Export button in the top-right corner
- Choose your preferred format: CSV or Excel
- Select the data range and metrics to include
- Click Download to save the file
Troubleshooting
Metrics Not Updating
If your dashboard metrics aren't updating in real-time:
- Refresh the page (F5 or Ctrl+R)
- Check your internet connection
- Clear browser cache and cookies
- Ensure DraftMerge extension has permission to access Gmail API
Missing Data
If certain campaigns or metrics are missing:
- Check the date range filter — older campaigns may not be visible
- Verify the campaign was created with your current Gmail account
- Ensure tracking pixels are not blocked by your email client settings
Incorrect Metrics
If metrics seem inaccurate:
- Open rate too low: Many email clients block images by default, which prevents open tracking
- Reply rate too high: Check if auto-responders are being counted as replies
- Bounce rate too high: Review your contact list for invalid email addresses